
Incidents
Everything Drumbeats records about a single outage, and what you can do to it while it is open.
An incident is one outage, from the moment a monitor goes DOWN to the moment it recovers. Every alert, acknowledgement, delivery attempt, and timeline event for that outage rolls up under it.
RESOLVED is the only terminal state. There is no "close without resolving". A job that stops pinging entirely keeps its incident open until a success arrives or you pause the monitor.
Why an incident opened#
The IncidentEvent field tells you which rule fired.
| Event | Trigger | Monitor types |
|---|---|---|
MISSED | The expected window closed without a success ping | Cron, Heartbeat |
FAILED | A failure ping, a non-zero exit code, a hung run, or three failed HTTP checks | All |
DURATION_HIGH | The run finished but took longer than max_duration_seconds | Cron, Heartbeat, Event-driven |
DURATION_LOW | The run finished faster than min_duration_seconds | Cron, Heartbeat, Event-driven |
SSL_EXPIRING | The TLS certificate crossed 30, 14, 7, or 1 day remaining | Uptime |
DURATION_HIGH, DURATION_LOW, and SSL_EXPIRING open an incident without flipping the monitor DOWN. They are advisories.
A DURATION_LOW on a job with a stable runtime usually means it exited early rather than ran fast, so it is worth setting on anything whose duration you can predict.
What the states mean#
| State | Meaning | How it gets here |
|---|---|---|
OPEN | Active problem, the assigned groups were paged | The monitor flipped DOWN |
ACKNOWLEDGED | Someone is on it. Still open, paging paused | A person clicked Acknowledge, or called the REST API |
RESOLVED | The job recovered and the groups got a recovery message | Automatic on the next success. Manual resolution is possible but obscures the real recovery time |
What happens when a monitor goes DOWN#
- Drumbeats records the failure event.
- The monitor flips DOWN once
failure_toleranceorschedule_toleranceis reached. - An incident opens with the matching event.
- Every channel in every assigned group fires in parallel, unless surge protection has paging paused.
- The timeline keeps recording: further failures,
logevents, acknowledgements, delivery results, and finally the recovery.
How you get alerted#
The incident pages the notification groups on the monitor, plus any channels assigned directly. The message names the monitor, the event, and the time, and links back to this page. Alert logic governs whether that happens at all.
Acknowledge an incident#
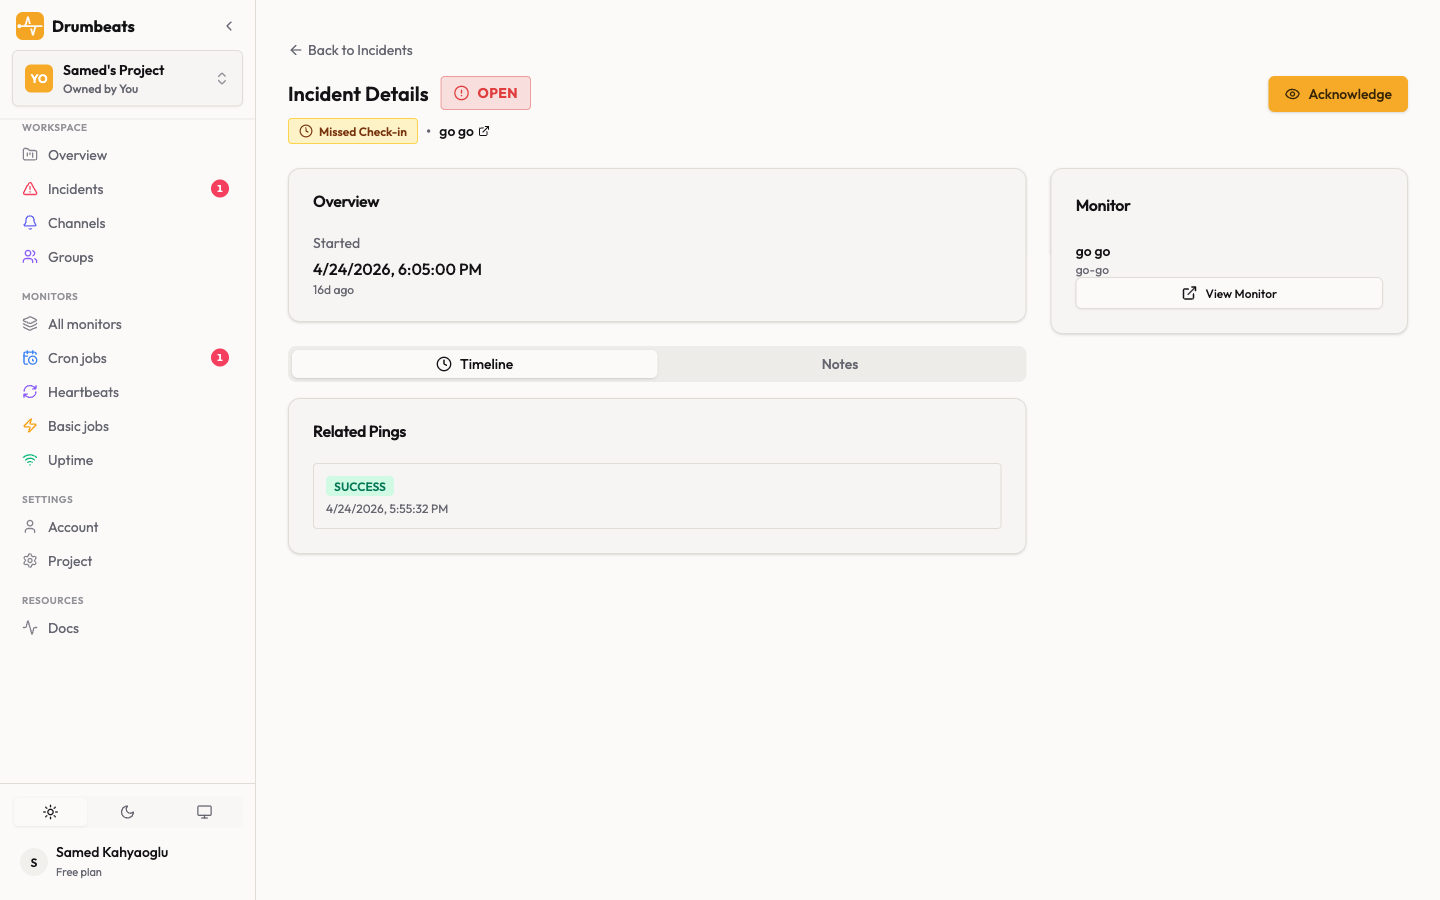
Acknowledging tells your team someone is working on it. It does not resolve anything. The monitor still needs a success ping.
What it does change is the paging. An acknowledged incident stops nudging the on-call rotation while the fix is in progress, and new failures still extend the timeline underneath.
curl -X POST https://api.drumbeats.io/v1/incidents/<incident-id>/acknowledge \
  -H "X-API-Key: $DRUMBEATS_API_KEY"
curl -X POST https://api.drumbeats.io/v1/incidents/<incident-id>/acknowledge \
-H "X-API-Key: $DRUMBEATS_API_KEY"Or click Acknowledge on the incident.
What recovery does#
A success ping, or a passing check on an Uptime monitor, closes the loop:
- The incident moves to
RESOLVED. - The groups that were paged get a recovery message with the outage duration.
- The monitor flips back to UP.
- The failure, miss, and alert counters reset, so the next outage starts fresh rather than continuing this one.
Read the timeline#
The incident detail page shows the outage in order: every ping with its event type, source IP, and payload preview; every status transition; every notification delivery with its per-channel result; and every manual action.
If the failing job posted its stderr as a payload, it renders inline. That is usually the difference between diagnosing from the incident page and opening a shell on the host.
Tune the sensitivity#
| Setting | Raise it when | Cost of raising it |
|---|---|---|
grace_period_seconds | Jobs start late because the host is busy | Slower detection of genuinely missed runs |
failure_tolerance | The job has known transient errors | You find out one whole run cycle later |
schedule_tolerance | The scheduler is loose about timing | Missed runs go unreported for that many windows |
max_duration_seconds | Legitimate runs are being flagged as hung | A truly hung run takes longer to surface |
alert_surge_threshold | A failure loop is flooding the channel | More noise before the storm is capped |
Every one of these trades detection speed for quiet. Tune per monitor. A flaky scraper and a nightly backup want opposite settings.
Next#
Alert logic for the thresholds in that table. Channels for where incident messages land. REST API incidents for acknowledging and resolving from code.